

Content Delivery Networks (CDNs) have become an important part of the Internet’s infrastructure, storing caches of popular international content locally. This means users can access services such as YouTube, Facebook and Netflix faster and cheaper than if they had to send and wait for content from the US or wherever else in the world the service organization is incorporated.
The success of this model relies on several factors including the number of CDNs hosted in-country, the amount of content they store and the performance of the transnational networks that are linking them to international servers. My team and I, at the University of California, Riverside, were interested in understanding the impact of the latter of these factors on Internet performance, particularly in our home-country, China.
Key points:
- Transnational network performance is fast and stable for most economies except for China and many in Africa.
- 79% of 400 measured in-bound transnational connections to China had throughput rates lower than 1Mbps.
- Packet loss occurs for only inbound traffic.
- Instances of slowdown can last almost all day and differ between receiver-sender economies.
Measuring global transnational network performance
We started by measuring the transnational Internet performance between 29 economies and regions, with wide geographic coverage and a variety of economic development levels.
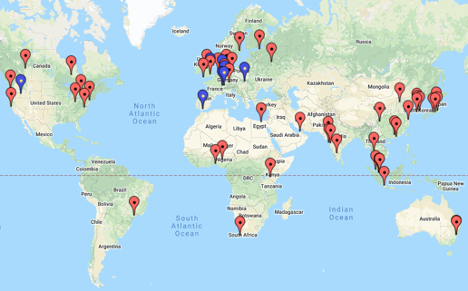
Most economies and regions we found have fairly stable and fast transnational networks with the exception of China and Africa. (For the rest of this blog, we use ‘China’ to refer specifically to mainland China.)
The box plot in Figure 2 summarizes our results.
The pairs are named by receiver-sender instead of client-server, because we care more about the direction of data flow. For example, China-Others refers to traffic being sent to China. As you can see, the boxes of the downstream and upstream of African economies and the downstream of China are very large — their mean is only around 2.5Mbps. On the contrary, the boxes of the other economies (Others-China and Others-Others) are very small.
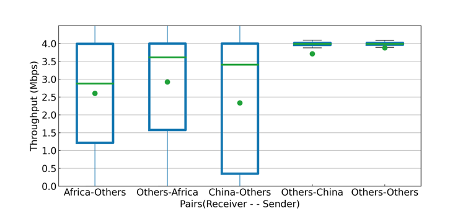
Although both African economies and China suffer from unstable throughput, their features are different. African economies experience slowdown in both directions. In contrast, China only experiences it in one direction — when data is entering China. China’s upstream, on the contrary, is fast and stable, like the rest.
Because our original sample included only a small number of vantage points in China, we weren’t sure if this observation was a random incident. To help clarify this we performed additional experiments measuring more than 400 receiver-sender pairs in China and foreign nodes over more than 53 days.
Taking a closer look at China’s transnational network performance
We found China’s transnational networks have several interesting features:
- Slow speed occurs extensively for transnational traffic. We recorded 79% of measured in-bound connections with throughput lower than 1Mbps.
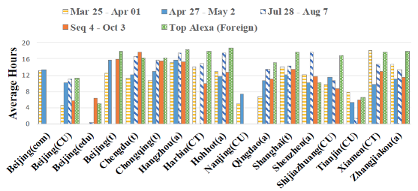
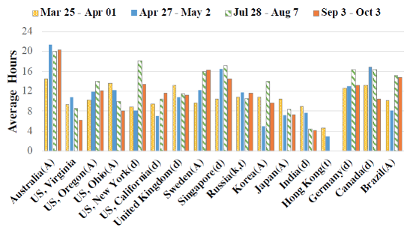
- Slow transnational network speed is prevalent in almost every city, happening everyday. It occurs to Top-Alexa websites as well. Figure 3 shows the average slowdown hours per day by receiver and Figure 4 shows the average slowdown hours per day by sender. All receivers and senders suffer from slow speed, with varied degrees.
- Packet loss in only one direction. We calculated the end-to-end loss rate and found only packets travelling into China are lost, the other direction (China > International) barely has packet loss. Also, all packet types share the same packet loss — TCP, UDP and ICMP don’t have noticeable differences.
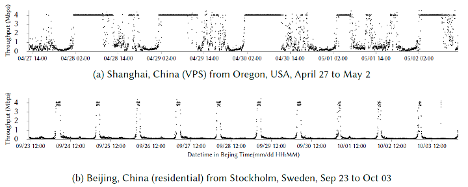
- The slow speed follows varied diurnal patterns. For example, Figure 5.a shows a lot more variable slowdown instances compared to Figure 5.b, which shows the slowdown starting early in the morning from 06:00 (UTC +8) and lasting all the way through to 03:30 (UTC +8) the next day. Another thing that is worth noting is that 1 and 2 May are national holidays in China, and 1 October is the national day and China’s 70th anniversary, which means the slowdown is not affected by important national holidays or weekends.
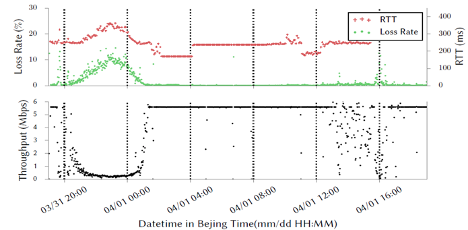
- From the end-to-end tests, we observed high correlation between low throughput, increased end-to-end loss rate, and increased latency, which generally conforms with normal congestion analysis. The diurnal pattern can also be explained by normal congestion as there is more traffic during the daytime and less at midnight. However, this is not to rule out the possibility that the congestion can be artificially imposed (for example, by lowering the bandwidth).
- The bottleneck mostly occurs within China. A recent report claims China’s network is like an Intranet. First of all, China disallows foreign ISPs to operate within the economy and only recently lifted the restriction for some. Also, the report claims that China is connected to the rest of the Internet primarily through a limited number of connection points, which are always physically located outside of China, where most traffic passes through the United States and western Europe. In other words, if the router is located within the physical border of China, it is most likely controlled by Chinese ISPs. Our results show that in 71% of cases, the bottleneck hops are located deep in China, which is abnormal because we know the domestic infrastructure can handle the domestic traffic pretty well, however, it fails to handle the smaller transnational traffic. This does not make sense from an economic perspective, as it is much more expensive to construct transnational links such as submarine cables, which are interestingly, often not the cause of the bottleneck.

What’s causing these speed reductions
We came up with two hypotheses to answer this from China’s perspective:
- The slowdown is due to some government regulation, for example, serving the purpose of censorship.
- The slowdown is due to the financial motivations of Chinese ISPs, attempting to make a profit off international peering.
Hypothesis 1: Government regulation
First, we want to ascertain whether the observed bottleneck is an artifact of some simple traffic differentiation policies, for example, packet drops based on protocols, or based on packet types or speed. We performed a number of A/B tests from which we found no noticeable differences between them.
As China is known for its advanced censorship capabilities, it is natural to suspect it has something to do with the slowdown, especially when the slowdown patterns are so diurnally regular. One possible explanation is that the Great Firewall (GFW) is very sensitive in processing large volumes of transnational traffic and can become overwhelmed easily. However, the GFW operates as an on-path system, which only processes copies of existing packets without the ability to discard packets. In addition, we designed a small experiment to locate the hops with GFW presence using TTL-limited probes, and then tried to match them with the bottleneck hops — we found that it is matching in only 34.45% of the cases.
The Great Canon, on the other hand, is indeed an in-path system. But we have no evidence of it being repurposed for traffic throttling. In fact, as mentioned, the slowdown characteristics from the previous measurements closely match those in a natural congestion.
Hypothesis 2: Financial motivation
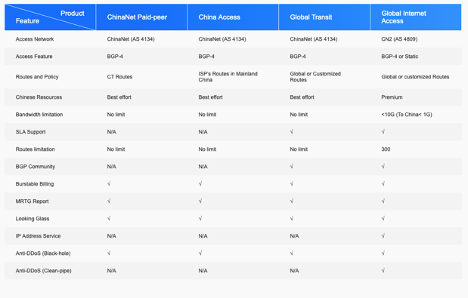
A more plausible reason is financially related. In the early years, Chinese ISPs did not have a good reputation for making international peering easy, because they wanted to grow their own transit business and make themselves top-tier ISPs. According to the official report, all of the three state-owned ISPs have set up a premium transnational network to maximize their profit. For example, China Telecom offer four tiers of services to connect to Chinese users (Figure 8).
To verify the existence of tiered services, we found an exotic virtual private server provider reselling these tiers of networks through hosting, which provided test IPs that allow customers to check the loss rate and latency to these nodes from within China. We found the loss rate does decrease with the tier of networks.
At the end of the day, we admit that this analysis is largely a best-effort one, based on our data, and we believe pinpointing the root causes further would require potentially insider knowledge about government policy and the inner workings of ISPs.
Pengxiong Zhu is a PhD candidate at the Department of Computer Science and Engineering, University of California, Riverside, under the supervision of Professor Zhiyun Qian.
The views expressed by the authors of this blog are their own and do not necessarily reflect the views of APNIC. Please note a Code of Conduct applies to this blog.
Very interesting hypothesis. What is interesting is the lack of collaboration between the in country ISPs and network service providers, and the lack of peering bandwidth between vendors. We have seen customers who appear on the surface to have excellent connectivity, and high bandwidth connections experience significantly performance issues when their international bound network traffic routes from one vendor to another in country, which suggests that competitors are not playing nicely together…